Waterfall Chart Template
Show how you got from the starting number to the ending number. Open this waterfall chart template, enter your steps, and export an editable PowerPoint chart.
Open this template → or start from scratch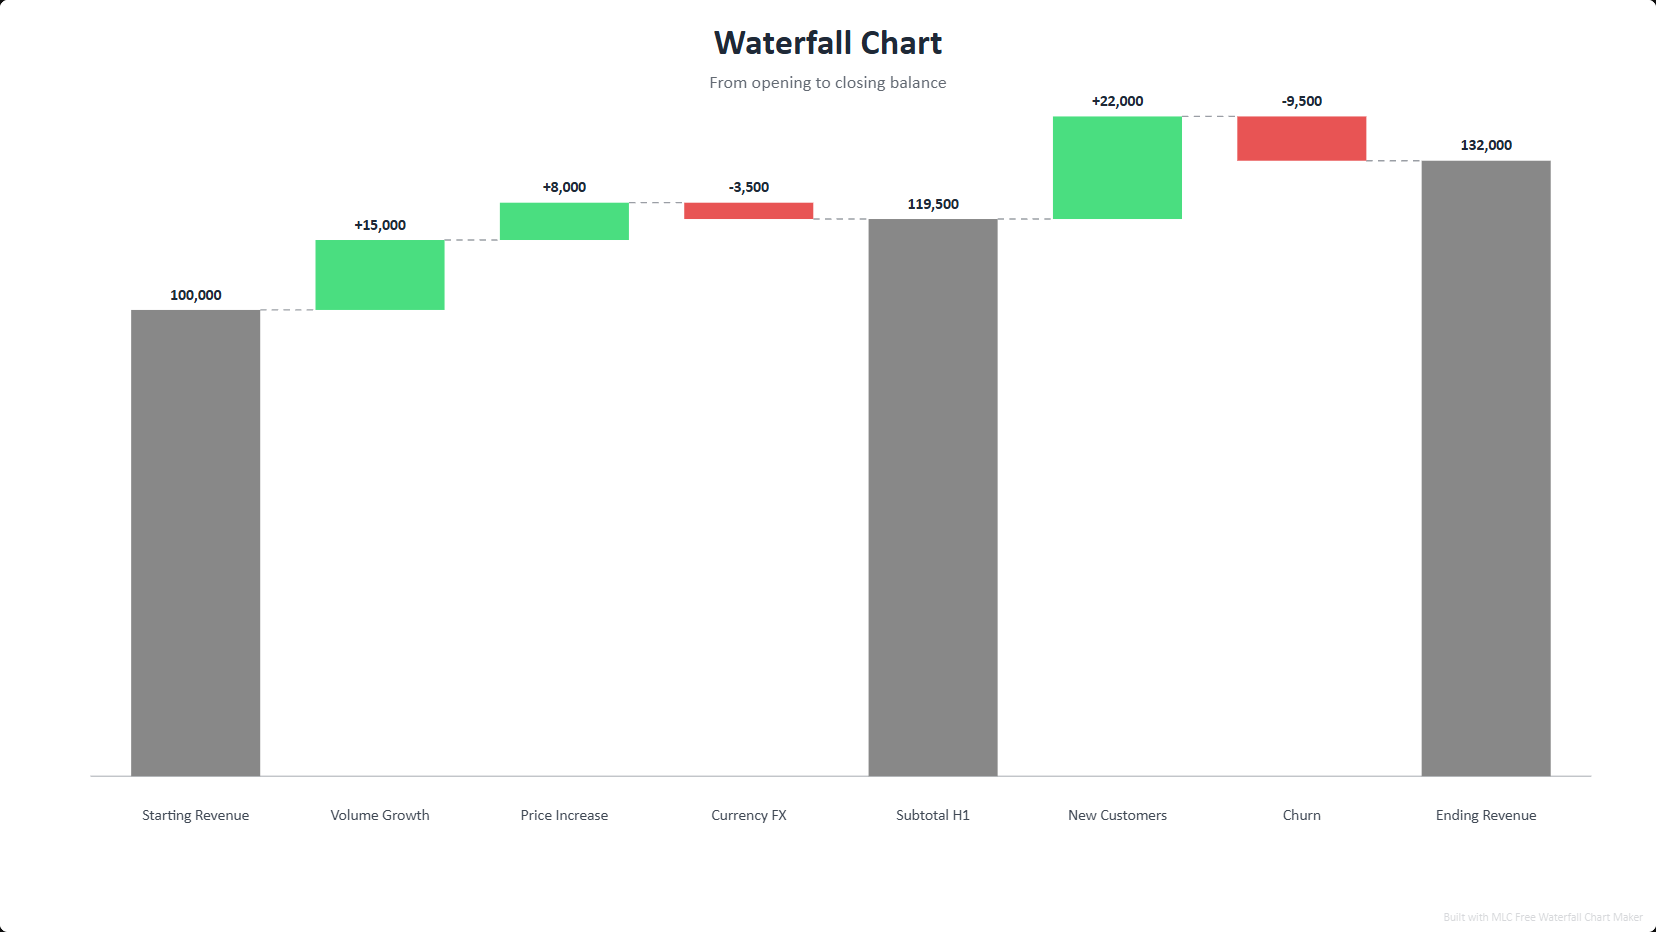
What is a waterfall chart?
A waterfall chart (also called a bridge chart) starts from an opening value, stacks each positive and negative step on top of the running total, and lands on the closing value. Increases and decreases are coloured differently and subtotals can be pinned along the way, so the audience sees not just that a number moved but exactly what moved it.
How to use this template
Open the template
Click the button above — the waterfall chart opens in the editor, already filled in. No account or password. A one-time professional profile unlocks all exports for one year.
Edit your data
Replace the sample entries with your own; the chart updates live as you type.
Style it
Pick a visual style and color palette to match your deck.
Export to PowerPoint
Download a .pptx with native, editable shapes — or PNG and Excel.
Ready in two minutes
Open the waterfall chart template, drop in your data, and export a native, editable PowerPoint slide. No account or password. A one-time professional profile unlocks all exports for one year. No watermark.
Open this template →Why export to PowerPoint matters
Most free chart tools give you a flat PNG, or lock PowerPoint export behind a paywall. This template exports real, editable PowerPoint shapes and text — so you can drop the chart straight into your deck and restyle it in PowerPoint, Google Slides or Keynote. That is the difference between a picture and a slide.
Frequently asked questions
Explaining the movement between two numbers, for example last year to this year, budget to actual, or gross to net. Each bar is one driver of the change.
Type a negative value. The bar automatically renders as a decrease hanging from the previous running total, in the decrease colour.
Yes. The Excel export includes the data table with native running-total formulas, so the numbers stay live. PowerPoint export gives native editable shapes.
Yes, 100% free, no account or password. A one-time professional profile unlocks all exports for one year. No watermark.