OKR Dashboard Template
Show OKR progress without a spreadsheet dump. Open this OKR dashboard template, set each key result against its target, and export an editable PowerPoint slide.
Open this template → or start from scratch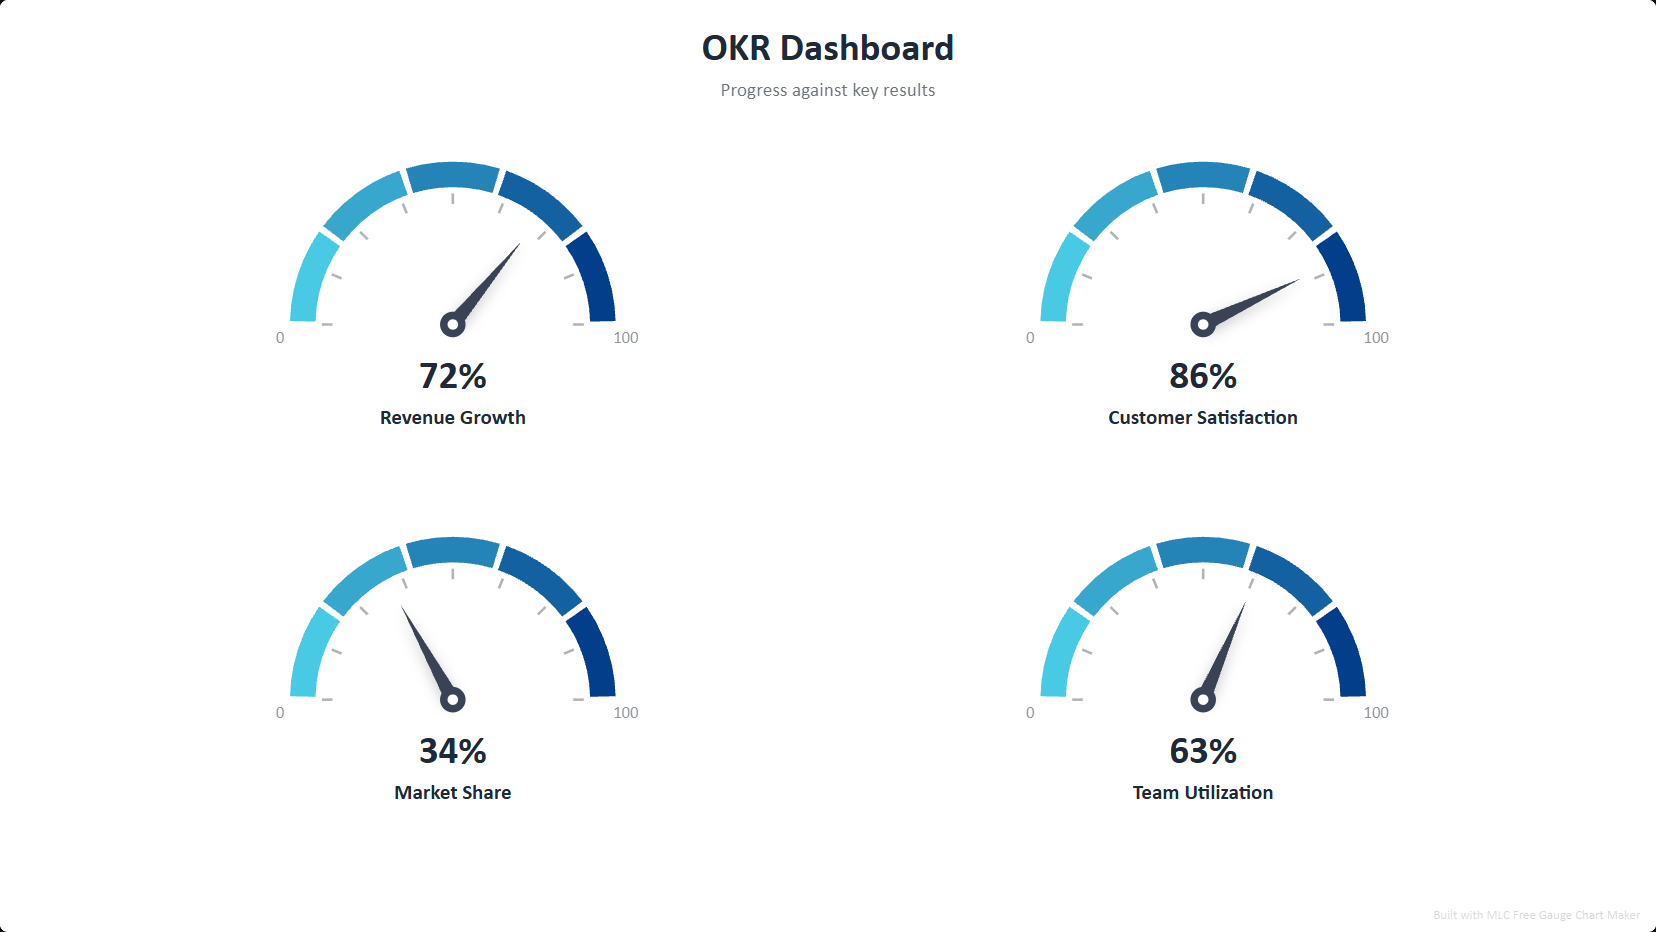
What is a OKR dashboard?
An OKR dashboard puts each key result on its own gauge, reading current value against the target set at the start of the quarter. Because a gauge encodes progress as position on a scale rather than as a number in a table, the room can see in one second which key results are on track and which need a decision, which is the entire point of the check-in.
How to use this template
Open the template
Click the button above — the OKR dashboard opens in the editor, already filled in. No account or password. A one-time professional profile unlocks all exports for one year.
Edit your data
Replace the sample entries with your own; the chart updates live as you type.
Style it
Pick a visual style and color palette to match your deck.
Export to PowerPoint
Download a .pptx with native, editable shapes — or PNG and Excel.
Ready in two minutes
Open the okr dashboard template, drop in your data, and export a native, editable PowerPoint slide. No account or password. A one-time professional profile unlocks all exports for one year. No watermark.
Open this template →Why export to PowerPoint matters
Most free chart tools give you a flat PNG, or lock PowerPoint export behind a paywall. This template exports real, editable PowerPoint shapes and text — so you can drop the chart straight into your deck and restyle it in PowerPoint, Google Slides or Keynote. That is the difference between a picture and a slide.
Frequently asked questions
One gauge per key result, each showing the current value against its target range, grouped under the objective. This template lays that out for you.
Yes. Set the scale from 0 to 100 and enter progress as a percentage, or keep absolute values and set your own min and max.
Yes, every gauge exports as native editable PowerPoint shapes, plus PNG and Excel.
Yes, 100% free, no account or password. A one-time professional profile unlocks all exports for one year. No watermark.