Gantt Chart Template
Plan the whole project on one slide. Open this Gantt chart template, adjust the phases and dates, and export a native PowerPoint chart your stakeholders can actually read.
Open this template → or start from scratch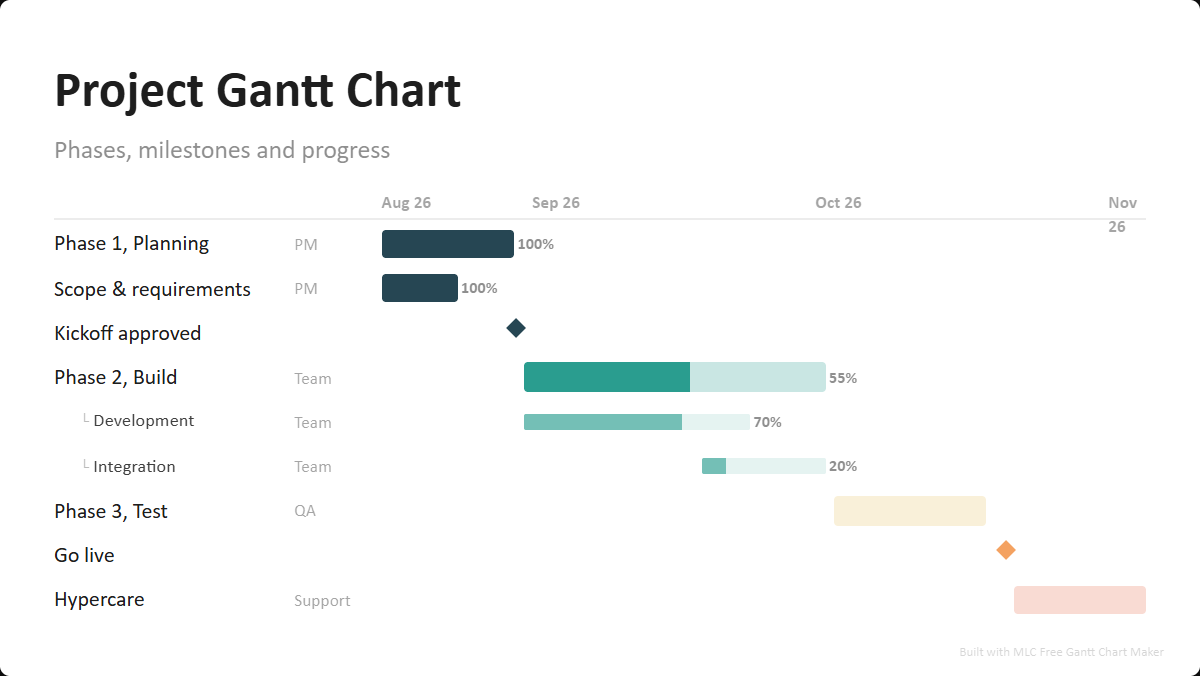
What is a Gantt chart?
A Gantt chart lays every task out as a horizontal bar on a calendar, so duration, sequence and overlap are visible at a glance. Phases group the work, diamonds mark milestones, and the fill of each bar shows percent complete. It is the standard way to show a plan to people who will not open your project-management tool.
How to use this template
Open the template
Click the button above — the Gantt chart opens in the editor, already filled in. No account or password. A one-time professional profile unlocks all exports for one year.
Edit your data
Replace the sample entries with your own; the chart updates live as you type.
Style it
Pick a visual style and color palette to match your deck.
Export to PowerPoint
Download a .pptx with native, editable shapes — or PNG and Excel.
Ready in two minutes
Open the gantt chart template, drop in your data, and export a native, editable PowerPoint slide. No account or password. A one-time professional profile unlocks all exports for one year. No watermark.
Open this template →Why export to PowerPoint matters
Most free chart tools give you a flat PNG, or lock PowerPoint export behind a paywall. This template exports real, editable PowerPoint shapes and text — so you can drop the chart straight into your deck and restyle it in PowerPoint, Google Slides or Keynote. That is the difference between a picture and a slide.
Frequently asked questions
Phases, the tasks inside each phase, start and end dates, an owner, percent complete and the milestones that gate the plan. This template ships with all of them filled in.
Yes. Every bar, milestone and label exports as a native, editable PowerPoint shape, so you can restyle it inside your deck. PNG and Excel export are included too.
Yes. Use Import to paste or upload rows with task name, start, end and owner, and the chart builds itself.
Yes, 100% free. No account or password. A one-time professional profile unlocks all exports for one year. No watermark and no task limit.